Business Risk Analysis
Excel Template
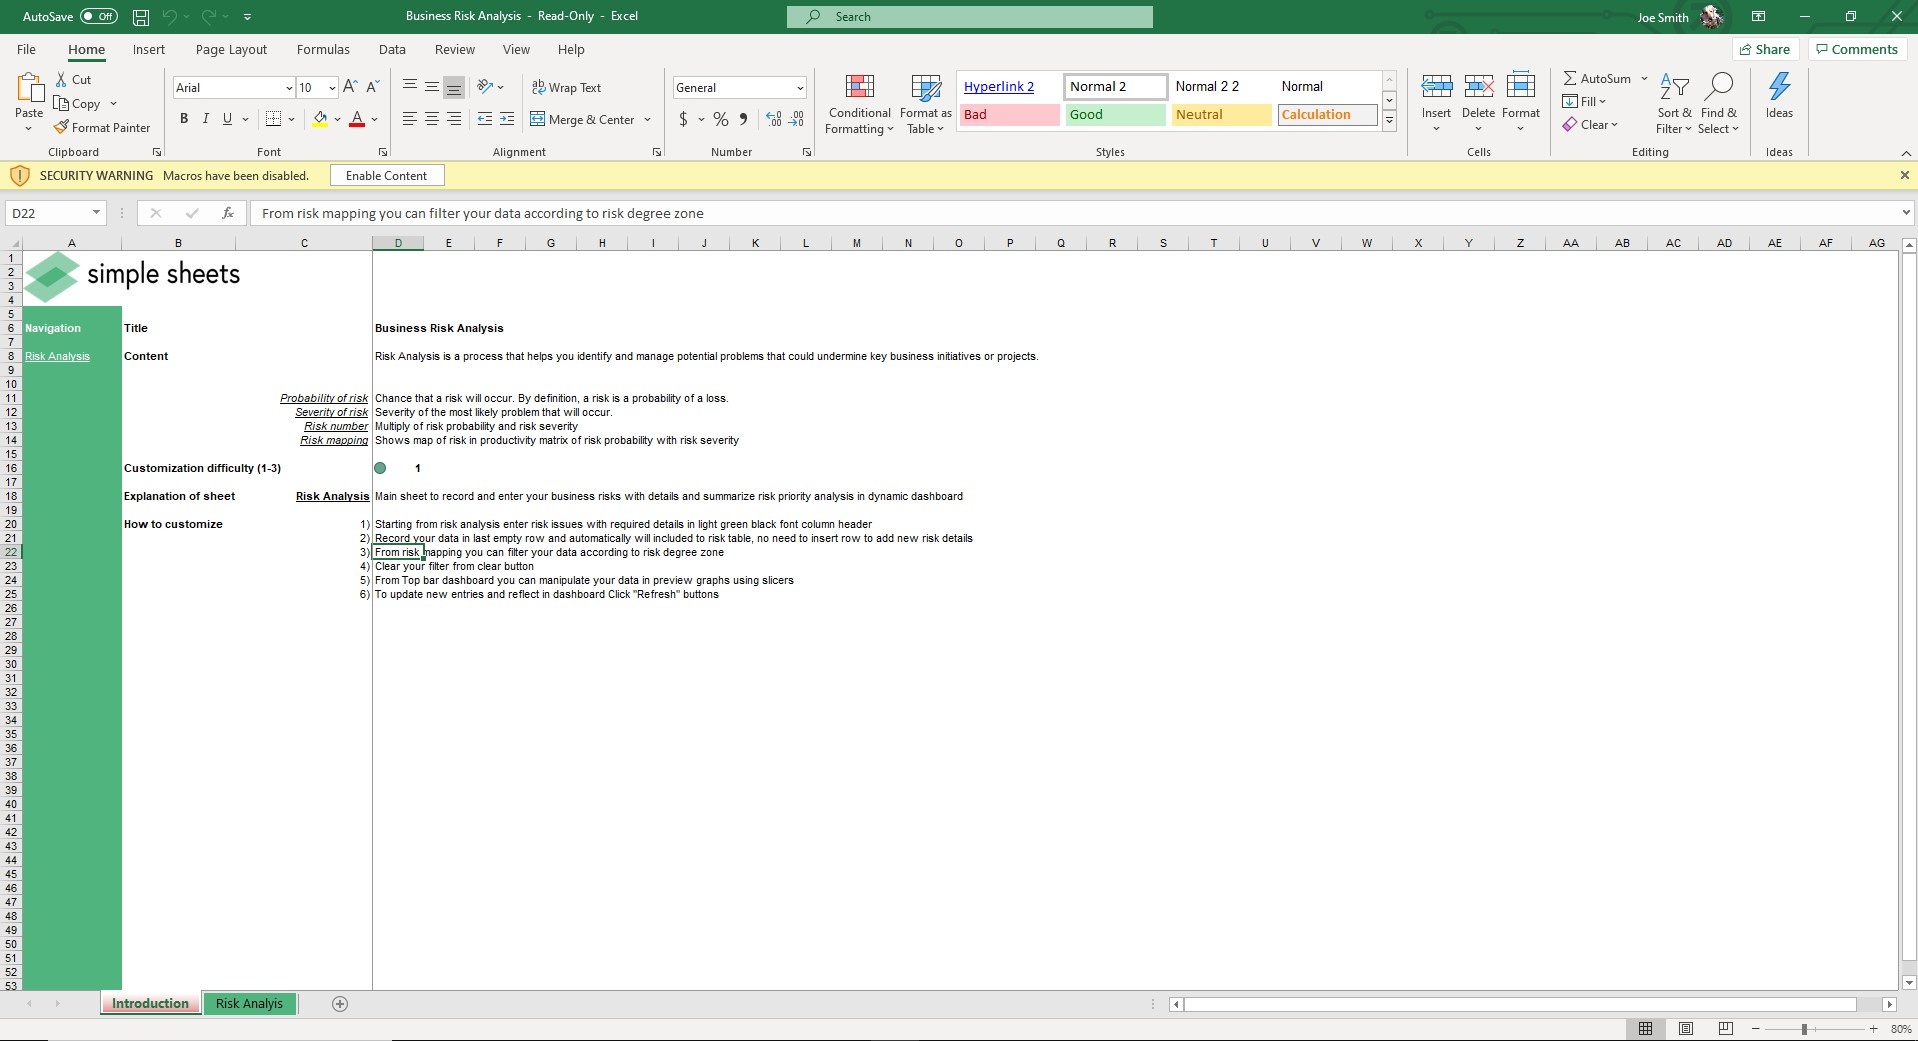
Identify and manage potential problems that may undermine key business initiatives or projects with our Business Risk Analysis Excel Template. Heat Maps, Graphs, and Charts update dynamically and help put your business risks into perspective.
What's Inside the Business Risk Analysis Template?
Details | 2 Sheets
Supported Versions (All Features) | Excel 2013, 2016, 2019, Office 365 (Mac)
Supported Versions (Significant Features) | Excel 2010, 2013, 2016, 2019, Office 365 (Mac)
Category | Management
Tags | Risk Assessment
Why Professionals Choose Simple Sheets
It's simple. Access to the largest library of premium Excel Templates, plus world-class training.

100+ Professional Excel Templates
Optimized for use with Excel. Solve Excel problems in minutes, not hours.

World-Class Excel University
With our university, you'll learn how we make templates & how to make your own.

How-To Videos
Each template comes with a guide to use it along with how-to videos that show how it works.
Inside Our Business Risk Analysis
Excel Template
You can only win as many chips as you bet, to put it in poker terms.
Our Business Risk Analysis Excel Template provides a framework for quantifying the probability and severity of a risk.
Before we dive into how to use this template, here’s why we love this template:
Data, by itself, doesn’t always jump off the page. Our brains may be contextualizing numbers, but that’s not a transparent process as it happens in our own head and can’t be seen by others.
This is why data visualization is so important. Graphs, charts and colors make trends obvious. When you’re presenting to co-founders, colleagues, investors or clients, they don’t have time to dig through the data like you do. With visuals, they can see what you see and make better decisions.
This template has a number of visuals that help assess risk. You can see Risk Issues by Category (ranging from Weak to Dangerous), Risk % Per Department, Risk Degree vs. Remain Days, and Risk Mapping, which demonstrates the probability and severity of a risk by color (red, yellow and green - like a stoplight) on a graph.

Making educated decisions about risk can change the trajectory of your company. We believe this template can help you make exponentially better decisions.
Start by entering Risk Issues in the Risk Analysis sheet. Fields include Related Department, Probability, Severity, Risk Number, Degree, Action Taken, Status, Due Date and (Days) Remaining.
Want to wipe your slate of data clean? Easy. Click the Clear button in cell 010. Want to refresh the visuals with updated risks and data? Also easy. Click Refresh in cell M10.
If you’re a business analyst or in management, we know this template will be a key part in helping you mitigate risks and maintain your key strategic positions.


